Example 9.8: Volume of a Gas Sample
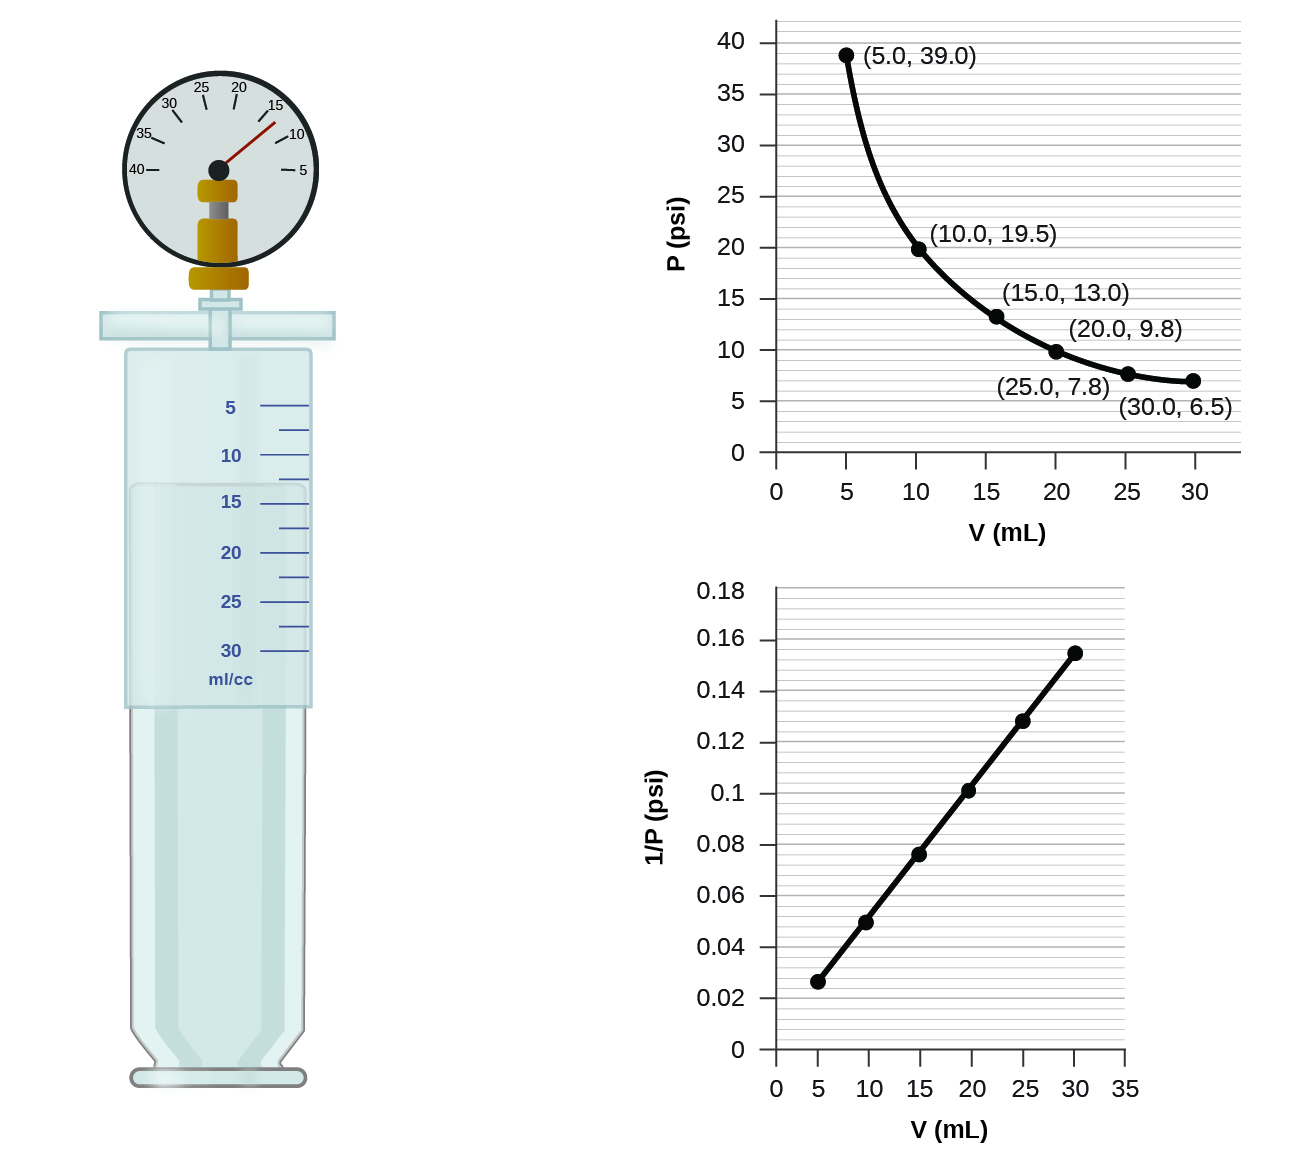
The sample of gas in
Figure 13 has a volume of
15.0 mL at a pressure of
13.0 psi. Determine the pressure of the gas at a volume of
7.5 mL, using:
(a) the
\(\ce{P-V}\) graph in
Figure 13
(b) the 1/P vs. V graph in
Figure 13
(c) the Boyle’s law equation
Comment on the likely accuracy of each method.
Solution
\(\mathrm{psi}\) \(= 6894.76\ \mathrm{Pa}\)
\(V_{\mathrm{1}}\) \(= 15.0\ \mathrm{mL}\)
\(P_{\mathrm{1}}\) \(= 13.0 \cdot \mathrm{psi}\)
\(\ \ \ =13.0 \cdot 6894.76\ \mathrm{Pa}\)
\(\ \ \ =8.96\times 10^{4}\ \mathrm{Pa}\)
\(V_{\mathrm{2}}\) \(= 7.5\ \mathrm{mL}\)
\(P_{\mathrm{2}}\) = ?
(a) Estimating from the
\(\ce{P-V}\) graph gives a value for P somewhere around
27 psi.
(b) Estimating from the 1/P versus V graph give a value of about
26 psi.
(c) From Boyle’s law, we know that the product of pressure and volume
\(\ce{(PV)}\) for a given sample of gas at a constant temperature is always equal to the same value. Therefore we have
\(P_{\mathrm{1}} \cdot V_{\mathrm{1}} = P_{\mathrm{2}} \cdot V_{\mathrm{2}}\)
Solving for the unknown P2:
\(P_{\mathrm{2}}\) \(= P_{\mathrm{1}} \cdot \dfrac{V_{\mathrm{1}}}{V_{\mathrm{2}}}\)
\(\ \ \ =8.96\times 10^{4}\ \mathrm{Pa} \cdot \dfrac{15.0\ \mathrm{mL}}{7.5\ \mathrm{mL}}\)
\(\ \ \ =8.96\times 10^{4}\ \mathrm{Pa} \cdot 2.000\)
\(\ \ \ =1.79\times 10^{5}\ \mathrm{Pa}\)
\(P_{\mathrm{2}}\) \(= \dfrac{P_{\mathrm{2}}}{\mathrm{psi}}\mathrm{\ \mathrm{psi}}\)
\(\ \ \ =\dfrac{1.79\times 10^{5}\ \mathrm{Pa}}{6894.76\ \mathrm{Pa}}\mathrm{\ \mathrm{psi}}\)
\(\ \ \ =\dfrac{1.79\times 10^{5}\ \mathrm{Pa}}{6894.760\ \mathrm{Pa}}\mathrm{\ \mathrm{psi}}\)
\(\ \ \ =26.0\mathrm{\ \mathrm{psi}}\)
It was more difficult to estimate well from the
\(\ce{P-V}\) graph, so (a) is likely more inaccurate than (b) or (c). The calculation will be as accurate as the equation and measurements allow.